ROY SHISHIR
STUDENT OF JADAVPUR UNIVERSITY
DEPARMENT OF ECONOMICS
DISINVESTMENT AND IT'S IMPACT ON INDIAN ECONOMY
http://www.ijrst.com/currentissue.php
Abstract
Disinvestment is a strange word. The common people can not easily run after the inner meaning of this interesting word. The question is that why such type of word is used in political economy? The answer is that there is some political trick to avoid some unprecedented political disturbance in the country. In this research paper, We should try to understand the definition and meaning of disinvestment and its related items. The disinvestment program has launched in India in 1991,the Watershed year ,depending on some economic misbalance and political pressure of developed countries ,IMF,WB,UNCTAD etc.Successively all the central government of India has sold or disinvested more shares of sick public sector as well as the profit making public sector to private enterprises after 1991 to till now. The GOI has advocated on the behalf of the disinvestment because she has dreamed that it will pursue the economic growth as well as economic development. Now we should check up the different indicator of economic development whether it changes up positively or negatively. So we should discuss in this research paper the development of social indicator such as latrine facility, Illiteracy rate ,life expectancy rate at birth, internet users, assets having in the households, child death rate, child and women labour security ,formal unemployment etc.It will be deeply identified in this paper the basic changes in GDP growth, export earnings, import bill , fiscal deficit ,govt. revenue earning ,govt. expenditure, India's business ranking in the world etc.Development is a functioning and GDP growth is a element of development function.
PUBLIC SECTOR – AN OVERVIEW
Historically, public sector undertaking (PSUs) have played an important role in the development of the Indian industry. At the time of independence, it was felt that political independence without economic self-reliance would be detrimental to the country's sovereignty and autonomy in policy making .Hence, the basic objectives of starting public sector were:
*To build infrastructure for economic development and promote rapid economic growth and industrialization of the country;
*To create employment opportunities and promote balanced regional development;
*To create a self-reliant economy through the development of the industries for import substitution and by encouraging and promoting exports;
*To generate investible resources for the development by earning suitable returns ; and finally
*To prevent/reduce concentration of private economic power.
In the sixties and seventies the public sector policy has been largely guided by the industrial policy resolution of 1956 which gave the public sector a strategic role in the economy .Massive investments have been made over the past four decades to build a public sector which had a commanding role in the economy. Many key sectors of the economy are today dominated by the mature public enterprises that have successfully expanded production opened up new areas of technology and built up a reserve of technical competence in a number of areas.
As a result the country's ranking in terms of industrialization with other developing countries in quite high. India's comparative advantages such as a large pool of well –trained work force, technical skills in manufacturing and chemical industries primarily stem from the public sector.
However, after the initial exuberance of the public sector entering new areas of industrial and technical competence, a number of problems began to manifest themselves in many enterprises. Problems were observed in terms of low productivity, poor project management skills, over manning lack of technological up gradation, inadequate attention to R and D and low priority.
ECONOMIC REFORMS
In the year 1980 the world economy was hit by sky rocketing oil prices, record high level interest rate and collapse of many primarily commodity prices. In this hostile environment many developing experienced acute balance of payment(BOP) problems which were generally accompanied by high government budget deficit and Inflation .This led then rely on assistance from International Monetary Fund and the World Bank in the forms of loan.Some of these carry certain conditions in respect of trade and price policies ,the size and structure of the government expenditure and the extent of government controls and productions. Hence structural adjustment process in most of the developing countries raised as a result a of economic crisis in the late 1970 and early 1980.
India after independence adopted the philosophy of welfare state. This resulted in enacting a series of labour legislation on order to provide protection and justice to the working class which was weak and defenseless. Hence the state assumed an interventionist role in industrial relation and it continues to hold the same position even after many changes have taken place in the industrial system.
But in recent times several changes took place particularly with regard to world trade and industrial relations and Indian economy had been in a bad shape. It has been witnessing ,a very high ratio of (internal and external) borrowing to the GNP and dismally low level of foreign exchange reserves.
The first phase of economic liberalization in India in 1980 with SDR 5 billion loan from the IMF.The loan was conditional on an adjustment program that initiated against the growth of the public sector and increased the leverage of the foreign sector. As a result of this condition the government liberalized the import regulated price controls; deregulated industrial production oriented industrialization towards export markets and toned down budgetary support for the public sector.
The package of economic reforms includes both stabilization and structural adjustment while the stabilization policy is indented to establish internal and external balances by compressing domestic demand through reduction in public expenditure and subsidies and indirectly through devaluation of currency ,monitoring policy etc.structural adjustment policy aims promoting market led growth through privatization trade liberalization ,deregulation ,disinvestment of public sector undertaking and soon. The main objectives are too promote economic efficiency and to make India so fit in the global economy.
LIBERALISATION
The word liberalization is ill defined and unfortunately prone to multiple interpretations. The most common connotation of the term, when used in the context of the term, when used in the context of economic policy is that of economic activity and the space of state intervention (except in all important matters of quarter in private property rights) and allowing for unfettered operation of market forces in determining economic process.
Beginning from mid eighties it was being realized that the country needs to open up its industrial sector not only internally but also to the outside world. A process of liberalization was initiated from 1985 onwards ,culminating into the formation of two industrial policies .One in 1980 and then in 1991.The 1991 industrial policy opened many more avenues for private sector by removing regulation ,scrapping 5
Monopolies Restrictive Trade Practices Act (MRTP) limits and decreasing the role of public sector by allowing part equity sale along with curtaining the industries in their exclusive domain.
Liberalization includes new fiscal and trade policies which would enable easier and less costly because of the reduction of the customers duties, import of technology and other components. Liberalization also includes easing of trade restrictions which would result in attracting multi nationals to invert and setup industries in India.
The process of liberalization, which was initiated in the early nineties of the last century, was not willfully accepted course for the country. The decision to introduce this economic liberalization brought when the country was witnessing a worst economic crisis in its history. One of the features of liberalization is the entry of foreign direct investment in several sectors of economy.
Important feature of liberalization is removal of 'License Raj' which did not permit the private sector to establish industries of their own choice. Now there is no need to visit ministers and departments for licenses. Another feature of liberalization is the easing of import restrictions. Many among the private sector, may think of upgrading technology at a reduced cost. Another feature is the removal of MRTP which would enable private sector to grow in size in the place of public sector.
PRIVATIZATION
In a narrow sense, privatization implies the intention of private ownership in publicly owned enterprise but in a broader sense, it connotes besides private ownership (or even without change of ownership) the induction of private management and control in the public sector enterprises.
Privatization is one of the major elements of the structural adjustment program gaining on in most part of the world. As many 50 countries both developed and developing opted for privatization of state owned enterprises between 1980 and 1987.
Private sector is considered to be a perfect amalgamation of all virtues and public sector as an example of inefficiency and corruption. However public sector does have its advantages as well – it stabilizes employment and reduces economic dependency on foreign capital. Public sector contributes to social equity as it provides to social services to the poor, through the role it plays in the labour market. For instance Andhra Pradesh State Road Corporation serves fourteen million people a day and provides concessions to many sections of the society even though the organization sustains in loss.
In India, the concept of privatization is the recent development that came in July 1991. Privatization of public sector enterprises was initiated at the behest of the World Bank and international monetary fund. In order to lower India's budget deficit to the level of required and to get financial support from the IMF, Indian government opted to dispose of 20 percent equity shares of selected PSE to mutual funds, financial institutions, workers and public.
There are various perspectives regarding the privatization issue. According to privatization supporters, this shift from public to private management is so profound that it will produce a monopoly of significant improvements boasting the efficiency and quality of remaining care to the indigent or extend education to poor or making disabled children to get educated.
According to third perspective, the issue is not simply whether ownership is private or public. Rather, the key question is under what conditions managers will be more likely to act in the public interest. Despite the criterions India went ahead with partial disinvestment of about 8 percent shares in 30 PSUs during January 1992 – March 1993 Divestiture of shares worth Rs.5000 corers during the 15 month period also establishes the governmental commitment to privatization.
GLOBALIZATION
Globalization refers to a world in which cultures, politics and economies in some sense come closer together. The concept can be defined as the intensification of worldwide social relations which link distinct localities in such a way that local happenings are shaped by events occurring many miles away and vice-versa. Globalization can also be described in terms of growing economic interdependence and cross-border linkages that increasingly connect countries worldwide, rapid advances in transport, communication and information technologies have facilitated the globalization process. Shifts in economic thinking policy and the behavioral economic agents have also contributed to increase opening and globalization. Both trade liberalization and the role of transnational corporations and financial institutions in increasing pace of capital mobility have provided a further contribution to the globalization process. By removing administrative barriers to the international movement of goods and capital, domestic and international liberalization policies alike have been essential to globalization.
INTRODUCING DISINVESTMENT IN INDIAN ECONOMY
Liberalization, Privatisation and Globalization was started from 1990.These three are implemented with more power and strength in 1998 .On the basis of discussion held at the meeting of the prime minister council on trade and industry on 11.12.1999,Government of India have decided to constitute special subject group from among the members of the council to consider and recommend implementation action points in the disinvestment area.
WHY DISINVESTMENT
Since reforms began in 1991,this is the first time after 1993-94 that one feels that reforms are going to go forward. Except industrial De-licensing and some changes in financial sector ,almost nothing has so far happened on domestic economic reforms. The second generation of reforms was to begin with public sector reform and privatization .Without this as a prerequisite, nothing else is possible. Nothing else can happen This report will express same skepticism about what is proposed for Indian Airlines. But more than these, two, what has been reputed in the media about the government intentions is the really possible signal. why is disinvestment necessary?
THE ROAD MAP:
Explain to citizens the benefits of disinvestment-more expenditure on education, health care and employment, lower interest rate, lower inflation and cost of the present status quo .Use Media Campaigns :
*Disinvestment should be driven by efficiency, rather than fiscal deficit compulsion,
*There should not be ad hoc sales nor any hang-ups about clinging on to 51% threshold level, new private shareholders will be in the minority on boards and realizations will be higher without this limit.
*If govt. equity is brought down to 26%, the enterprise will no longer be state on defined by Article 12 of the constitution .It will this be outside the orbit of the control vigilance.
DISINVESTMENT HISTORY
1.1 PAST DISINVESTMENT
1.1-1 Engineers India Ltd (EIL):PIB press release dated 14th January 2010 disinvestment of 10% paid up equity capital in Engineers India ltd (EIL) out of GOI'S shareholding of 90.40%.
The cabinet committee on economic Affairs (CCEA) approved the proposal for disinvestment of 10% paid up equity capital of EIL .out of government's shareholding in the domestic market through public offering .After this disinvestment the government shareholding in the company would come down to 80.40%.
It has also been decided that before the public offering the company will take the following steps:
i)Issue two bonus shares for every one share.
ii)Split one share of the face value Rs10 into two, the face value of RS5 each; and
iii)Decline special dividend of 1000% of the paid up equity capital.
EIL is a PSE under the Ministry of Petroleum and Natural Gas and is engaged in providing engineering and related technical services for petroleum refinement and other industrial projects. The GOI is holding 90.40 % paid-up equity capital of the company and balance is held by the general public .The shares of the company are listed on the stock exchange with less than 10% mandatory public shareholding.
1.1-2 SJVN LTD. COMPANY
No of share Divested 415000000
%age government Equity Divested (as% of past –Issue capital) 10.3
Issue Amount (Rs Crore) 1062.74 (NSE/BSE)
1.1-3 SALLUJ JAL VIDYUT NIGAMAM LTD (SJVNL)
Disinvestment of 10% paid up equity is (SJVNL)out of government of India shareholding of 75% CCEA decision.
The CCEA today approved the disinvestment of 10% equity of the company, out of its shareholding, through book building process in the domestic.After this disinvestment GOI shareholding in the company would come down to 65% and Government of Himachal Pradesh's shareholding in the company would remain same at 25% .The paid uo equity capital of the company at present is 4108.81 crore.
SJVNL, a joint venture GOI and executing projects relating to generate ,distribution,operation and maintainence and solve of power.
1.1-4 NMDC LTD
No of share Divested 332243200
%age Govt. Equity Divested(as% past-Issue capital) 8.38
Issue Amount (Rs crore) 9930.42(BSE/NSE)
1.1-5 RURAL ELECTRIFICATION CROP. LTD
No. of sharing Divested 42933000
Total No. of shares 171732000
%age Govt. Equity Divested (as % past-issue capital) 4.35
Issue amount 3530.04(NSE/BSE)
The CCEA today a proposal of Follow on public after (FPO) OF Rural Electrification corporation limited (REC) of 17173200 equity shares of Rs 10 each constituting 20% of existing paid up –capital which comprises fresh issue of 128799000 Equity shares (15% of existing paid-up capital) by selling shareholder I.e the president of India.
Background
The rural electrification corporation limited (REC) incorporated in july 1969 under the companies Act,1956 as a Development Financial Institution ic dedicated to the growth of the power sector in general and rural electrification in particular .REC has been financing power projects in generation ,transmission and distribution .During the 5th Five year plan ,REC made a disbursement of Rs 42248.34 crore.REC cumulative disburshment to various types of power projects till 31.03.2009 were Rs92400.65 crore.
1.1-5 NTPC LTD.
No of share diverted 412273220
Total no of shares 412273220
%age govt. equity divested (as% of post-issue capital) 5.00
Issue amount 8480.10(CRORE)
Disinvestment of 5% paid up equity capital in NTPC LTD out of GOI shareholding 89.50%.
According to CCEA decision the govt. equity come down 84.50%.NTPC limited is engaged in the business of power generation .
On disinvestment of the proposed equity it is expected that the market capitalization of NTPC would be higher resources in the international market on competitive tons.
1.1-6 OIL INDIA LTD.
CCEA has approved the disinvestment of 10% of oil paid up capital in favor of the three oil marketing companies (OMCs) viz IOC,HPCL and BPCL in the ratio 2:1:1 respectively
Issue amount Rs 2777.25
1.1-7 Shipping Corporation of India Ltd(SCI)
* Sale of 10% equity in the domestic market 42045365 shares/SEBI.
* 5% discount to retail investors on the issue price.
*0.50% reserve for company employee(423454) along with 5% discount offer price for employees.
The disinvestment of SCI is expected to generate approximately Rs 1300 crore.The govt. ownership in SCI is currently 80.12% and offer the above offer of sale and further issue of shares, the government holding will be 63.75%.This disinvestment will develop a roadmap for higher people ownership of this company while ensuring that government equity does not fall below 51%.
SCI is a Navratna company with a consistent track record of profits dividend It is the largest shipping company in India owning 75 ships of 5.10 million dwt.
1.1-7 Coal India Limited
No of shares Divested 631636440.
Total no of shares 631636440.
%age govt. Equity Divested (as% of post –issue capital) 10 Issue amount Rs 15199.44 (crore)
10% equity of CIL out of its holding of 100% through book building process in the domestic market.The CCEA also approved a 5% concession to employees.
Coal India Ltd(CIL) ,a cpse ,is a Navratna company engaged in production and marketing of coal and coal products.At present ,the paid up equity capital of the company is 6316.36 crore and the government of India holds 100% of the equity in the company.
1.1-8 Manganese ore (India) Ltd(MOIL)
CCEA has approved 5% discount for employees and retail investors.
At present central government told 81.57% of the equity of MOIL(a miniratna CPSE) .The balance is held by state government of Maharashtra and Madhyaprodesh to the extent of 9.62% and 8.81% respectively .MOIL is engaged in production of Manganese ore, which is the row materials for manufacturing of alloys an essential input for steel making and dioxide ore for manufacturing dry batteries .
No of shares Divested 33600000
%age govt. Equity divested (as % of post issue capital ) 20
Issue amount (Rs crore) 1237.51
1.1-9 ONGC
No of shares divested 420416170
%age govt. equity divested (as % of post issue capital)4.91
Issue amount (Rs crore) 12749.50
1.1-10 Power Finance Corp. Ltd
No of Shares Divested 57388335
Total no of shares 229553340
%age govt. equity (as % of post issue capital )4.35
Issue amount (Rs. Crore) 4578.20
1.1-11 NBCC
No of shares Divested 12000000
%age govt equity (as % of post capital) 10
Issue amount (Rs Crore) 124.97
1.1-12 NHPC Ltd
No of shares divested 559124672
Total no of shares 1677374015
%age govt equity (as % of post capital) 4.55
Issue amount 6.38.55
1.1-13 Power grid Corp. Ltd
No of shares divested 4200884123
Total no of shares 841768246
%age govt equity (as % of post capital ) 9.09
Issue amount 7442.34
1.2 RECENT DISINVESTMENT
1.2-1 Coal India Ltd
No of shares Divested 631636440
%age govt equity (as % of post capital ) 10.00
1.2-2 SAIL
NO of shares divested 206526264
%age govt. equity (as % of post capital) 5.00
Disinvestment of 10.82% paid up equity in SAIL out of GOI shareholding of 85.82%.After this shareholding GOI shareholding in the company would come down to 75%. The paid up equity of the company ,as on 31st March,2012 was Rs 4130.53 crore .SAIL is a listed Maharatna CPSE and is the largest domestic steel producing company .It is also engaged in the business of mining ,production,and marketing of iron and steel.
1.2-3 IOCL
No of shares divested 242795248
%age govt.equity (as % of post capital) 10
1.2-4 BHEL
No of shares divested 114100000
Total share 122380000
%age govt. equity (as% of post capital) 4.66
Issue amount Rs 1886.77 crore
GOI shareholding come down to 62.72%
1.2-5 EIL
No of shares divested 33693660
%age govt. equity (as % of post capital) 10.00
1.2- 6 STC-LTD
No of shares divested 613600
%age govt. equity (as % of post capital) 1.02
Issue amount ( Rs Crore ) 4.53
1.2-7 PGCIL LTD
No of shares divested 185189014
%age govt. equity (as % of post capital) 4.00
1.2-8 ITDC
No shares divested of 4288470
%age govt. equity (as % of post capital) 5.00
Issue amount ( Rs Crore ) 30.17
1.2-9 NHPC LTD
No shares divested of 1107159036
%age govt. equity (as % of post capital) 10
1.2-10 NLC LTD
No shares divested of 59701260
Total shares 83885480
%age govt. equity (as % of post capital) 3.56
1.2-11 NFL LTD
No shares divested of 37479940
%age govt. equity (as % of post capital) 7.64
1.2-12 NALCO
No shares divested of 156938918
%age govt. equity (as % of post capital) 6.09
1.2-13 HCC LTD
No shares divested of 37119152
Total no of shares 92521800
%age govt. equity (as % of post capital) 4.01
1.2-14 MMTC
No shares divested of 93312000
%age govt. equity (as % of post capital) 9.33
1.3 Forthcoming Disinvestment –Government Approval Received:
Rastriya Ispat Nigam Ltd
Hindustan Aeronautics Ltd
Oil and Natural Gas Corp. Ltd
NHPC
Power Finance Corp. Ltd.
Rural electrification Coro. Ltd.
Dredging Corporation of India Ltd
Moil Ltd , Videsh, KIOCL
Bharat Broad –Band Ltd; Mazagon Dock Ltd
Southern Coalfields
DISINVESTMENT PROCEEDS FROM SALE OF MINORITY SHAREHOLDING IN CPSEs OF 1991-00
Name of CPSE | 1991-92 (corer) | 1992-93 (corer) | 1994-95 (corer) | 1995-96 (corer) | 1996-97 (corer) | 1997-98 (corer) | 1998-99 (corer) | 1999-00 (corer) | 2003-04 (corer) |
AEL | * | ||||||||
BEL | * | 47.17 | |||||||
BEML | * | 48.27 | |||||||
BHEL | * | 8.21 | 301.34 | ||||||
BPCL | * | 331.18 | |||||||
BRPL | * | 45.50 | |||||||
CMC | * | ||||||||
Coal India | |||||||||
CONCOR | 97.5 | 14.12 | 221.65 | ||||||
CPCL | * | ||||||||
CPSE-ETP | * | ||||||||
DCIL | * | 221.20 | |||||||
EIL | 63.53 | ||||||||
FACT | * | 1.30 | |||||||
GAIL | 194.12 | 671.86 | 945.00 | 1627.36 | |||||
HCL | 8.07 | ||||||||
HIND-CABLES | * | ||||||||
HMT | * | 23.38 | |||||||
HOCL | * | ||||||||
HPCL | * | 331.85 | 563.11 | ||||||
HPF | * | ||||||||
HZL | * | 81.55 |
DISINVESTMENT PROCEEDS FROM SALE OF MINORITY SHAREHOLDING IN CPSEs OF 2004-2016
NAME OF CPSE | 2004-05 (CRORE) | 2007-08 (CRORE) | 2009-10 (CRORE) | 2010-11 (CRORE) | 2011-12 (CRORE) | 2012-13 (CRORE) | 2013-14 (CRORE) | 2014-15 (CRORE) | 2015-16 (CRORE) |
AYL | |||||||||
BEL | |||||||||
BEML | |||||||||
BHEL | 1886.78 | ||||||||
BPCL | |||||||||
CMC | |||||||||
COAL INDIA | 15199.44 | 22557.60 | |||||||
CONCOR | |||||||||
CPCL | |||||||||
DICL | |||||||||
EIL | 959.65 | 497.32 | |||||||
FACT | |||||||||
GAIL | |||||||||
HCL | 807.03 | 259.56 | |||||||
HINP-CABLES | |||||||||
HMT | |||||||||
HOCL | |||||||||
HPCL | |||||||||
HPF | |||||||||
HZL | |||||||||
BRPL | |||||||||
CPSE-ETF | 1300.00 |
DISINVESTMENT PROCEEDS FROM SALE OF MINORITY SHAREHOLDING IN CPSEs OF 1991-2000
NAME OF CPSE | 1991-92 (crore) | 1992-93 (crore) | 1994-95 (crore) | 1995-96 (crore) | 1996-97 (crore) | 1997-98 (crore) | 1998-99 (crore) | 1999-00 (crore) | 2003-04 (crore) |
IBP | 350.66 | ||||||||
IOC | 1033.65 | 1208.96 | 162.79 | ||||||
IPCL | * | ||||||||
IRCON | * | ||||||||
ITDC | 51.99 | ||||||||
ITI | * | 15.63 | |||||||
KIOCL | 11.40 | ||||||||
KRL | * | ||||||||
MMTC | * | ||||||||
MOIL | |||||||||
MTNL | * | 1322.17 | 135.90 | 910.00 | |||||
NALCO | * | 244.20 | 0.10 | ||||||
NBCC | |||||||||
NFL | * | 0.72 | 0.28 | ||||||
NHPC | |||||||||
NLC | * | 70.43 | |||||||
NMDC | |||||||||
NTPC | |||||||||
OIL | |||||||||
ONGC | 1051.52 | 5.16 | 2484.96 | 296.48 | 1054.40 | ||||
PFC | |||||||||
PGCIL | |||||||||
RCF | * | 70.36 | |||||||
REC | |||||||||
SAIL | * | 700.10 | 22.66 | 13.30 | |||||
SCI | * | 28.08 | |||||||
SJYN | * | ||||||||
STC | * | 2.25 | |||||||
VSNL | * | 379.67 | 783.68 | 75.00 |
DISINVESTMENT PROCEEDS FROM SALE OF MINORITY SHAREHOLDING IN CPSEs OF 2004-2016
NAME OF CPSE | 2004-05 (CRORE) | 2007-08 (CRORE) | 2009-10 (CRORE) | 2010-11 (CRORE) | 2011-12 (CRORE) | 2012-13 (CRORE) | 2013-14 (CRORE) | 2014-15 (CRORE) | 2015-16 (CRORE) |
IBP | |||||||||
IOC | 5341.49 | ||||||||
IPCL | |||||||||
IRCON | |||||||||
ITDC | 30.17 | ||||||||
ITI | |||||||||
KIOCL | |||||||||
KRL | |||||||||
MMTC | 571.71 | ||||||||
MOIL | 618.76 | ||||||||
MTNL | |||||||||
NALCO | 627.84 | ||||||||
NBCC | 124.97 | ||||||||
NFL | 101.08 | ||||||||
NHPC | 2012.85 | 2131.28 | |||||||
NLC | 358.21 | ||||||||
NMDC | 9930.42 | 5973.27 | |||||||
NTPC | 3684.07 | 8480.10 | 11457.54 | ||||||
OIL | 2247.05 | 3141.51 | |||||||
ONGC | 15.99 | 12749.50 | |||||||
PFC | 1144.55 | ||||||||
PGCIL | 994.82 | 3721.17 | 1637.32 | ||||||
RCF | 310.15 | ||||||||
REC | 819.63 | 882.51 | 1610.00 | ||||||
SAIL | 1514.50 | 1719.54 | |||||||
SCI | 582.45 | ||||||||
SJYN | 1062.74 | ||||||||
STC | 4.54 | ||||||||
VSNL |
Note: In 1991-92 shares of the CPSEs (marked*above) were sold in bundles, amount realized CPSEwise is not available. There was no receipt from sale of minority shares in 1993-94, 2000-2001, 2005-2006, 2006-2007, 2008-2009
SUMMARY OF RECEIPTS FROM DISINVESTMENT: 1991-92 TO TILL DATEAS ON 15.04.2015
Year | Budgeted receipt (Rs. Crore) | Receipts through sale of minority shareholding in CPSEs (Rs crore) | Receipts through sale of majority shareholding of one CPSE to another CPSE (Rs crore) |
1991-92 | 2500.00 | 3037.74 | |
1992-93 | 2500.00 | 1912.51 | |
1993-94 | 3500.00 | - | - |
1994-95 | 4000.00 | 4843.10 | - |
1995-96 | 7000.00 | 168.48 | - |
1996-97 | 5000.00 | 379.67 | - |
1997-98 | 4800.00 | 910.00 | - |
1998-99 | 5000.00 | *5371.11 | - |
1999-00 | 10000.00 | **1479.27 | - |
2000-01 | 10000.00 | - | 1317.23 |
2001-02 | 12000.00 | - | - |
2002-03 | 12000.00 | - | - |
2003-04 | 14500.00 | 12741.62 | - |
2004-05 | 4000.00 | 2700.06 | - |
2005-06 | no target fixed | - | - |
2006-07 | no target fixed | - | - |
2007-08 | no target fixed | 1814.45 | - |
2008-09 | no target fixed | - | - |
2009-10 | no target fixed | 23552.93 | - |
2010-11 | 4000.00 | 22144.21 | - |
2011-12 | 40000.00 | 13894.05 | - |
2012-13 | 30000.00 | 23956.81 | - |
2013-14 | 40000.00 | 15819.46 | - |
2014-15 | 39925.00 | 24277.17 | - |
2015-16 | 41000.00 | 1610.00 | - |
Grand Total | 160612.64 | 1317.23 |
SUMMARY OF RECEIPTS FROM DISINVESTMENT : 1991-92 TO TILL DATEAS ON 15.04.2015
year | Receipts through strategic sale (Rs. Crore) | Receipts from other related transactions (Rs crore) | Receipts from sale of residual shareholding disinvestment CPSEs/companies (Rs crore) |
1991-92 | - | - | - |
1992-93 | - | - | - |
1993-94 | - | - | - |
1994-95 | - | - | - |
1995-96 | - | - | - |
1996-97 | - | - | - |
1997-98 | - | - | - |
1998-99 | - | - | - |
1999-00 | 105.45 | 275.42 | - |
2000-01 | 554.03 | - | - |
2001-02 | 3090.09 | 2567.60 | - |
2002-03 | 2252.72 | 1095.26 | - |
2003-04 | 342.06 | - | 2463.73 |
2004-05 | - | 64.81 | - |
2005-06 | - | 2.08 | 1567.60 |
2006-07 | - | - | - |
2007-08 | - | - | 2366.94 |
2008-09 | - | - | - |
2009-10 | - | - | - |
2010-11 | - | - | - |
2011-12 | - | - | - |
2012-13 | - | - | - |
2013-14 | - | - | - |
2014-15 | - | 51.76 | - |
2015-16 | - | - | - |
Total | 6344.35 | 4056.93 | 6398.27 |
SUMMARY OF RECEIPTS FROM DISINVESTMENT: 1991-92 TO TILL DATEAS ON 15.04.2015
Year | Total receipts(Rs corer) | Transactions (Rs corer) | ||
1991-92 | 3037.74 | Minority shares sold in Dec, 1991 and Feb, 1992 by auction method in bundles of "very good", "good" and "average" companies | ||
1992-93 | 1912.51 | Shares sold separately for each company by auction method | ||
1993-94 | - | Equity of 6 companies sold by auction method but proceeds received in 94-95. | ||
1994-95 | 4843.10 | Shares sold by auction method. | ||
1995-96 | 168.48 | Shares sold by auction method. | ||
1996-97 | 379.67 | GDR –VSNL | ||
1997-98 | 910.00 | GDR –MTNL | ||
1998-99 | 5371.11 | GDR-VSNL; Domestic offerings of CONCOR and GAIL; Cross purchase by 3 Oil sector companies i.e. GAIL, ONGC and IOC. | ||
1999-00 | 1860.14 | GDR-GAIL; Domestic offering of VSNL; capital reduction and dividend from BALCO; Strategic sale of MFIL. | ||
2000-01 | 1871.26 | Sale of KRL, CPCL and BRPL to CPSEs; Strategic sale of BALCO and LJMC. | ||
2001-02 | 5657.69 | Strategic sale of CMC, HTL, VSNL, IBP, PPL, hotel properties of ITDC and HCI, slump sale of Hotel Centaur Juhu Beach, Mumbai and leasing of Ashok Bangalore; Special dividend from VSNL, STC and MMTC; sale of shares to VSNL employees. | ||
2002-03 | 3347.98 | Strategic sale of HZL, IPCL, hotel properties of ITDC, slump sale of Centaur Hotel Mumbai Airport, Mumbai; Premium for renunciation of rights issue in favour of SMC ; Put Option of MFIL; Sale of shares to employees of HZL and CMC. | ||
2003-04 | 15547.41 | Strategic sale of JCL; Call Option of HZL; Offer for Sale of MUL, IBP, IPCL, CMC, DCI, GAIL and ONGC; Sale of shares of ICI Ltd. | ||
2004-05 | 2764.87 | Offer for Sale of NTPC and spill over of ONGC; sale of shares to IPCL employees. | ||
2005-06 | 1569.68 | Sale of MUL shares to Indian public sector financial institutions & banks and employees | ||
2006-07 | - | |||
2007-08 | 4181.39 | Sale of MUL (Rs.2366.94 cr)shares to public sector financial institutions, public sector banks and Indian mutual funds and sale of PGCIL (Rs.994.82 cr) and REC (Rs.819.63 cr) shares through Offer for Sale. | ||
2008-09 | - | |||
2009-10 | 23552.93 | Rs.2012.85 - NHPC, Rs.2247.05 OIL , Rs. 8480.098 NTPC , Rs.882.52 REC, Rs.9930.42 NMDC | ||
2010-11 | 22144.21 | Rs.1062.74 SJVN , Rs. 959.65 EIL, Rs. 15199.44 COAL INDIA , Rs. 3721.17 PGCIL, Rs. 618.75 MOIL ,Rs. 582.45 SCI | ||
2011-12 | 13894.05 | Rs.1144.55 PFC,Rs. 12749.5 ONGC | ||
2012-13 | 23956.81 | Rs. 124.97 NBCC,Rs. 807.03 HCL, Rs. 5973.27 NMDC, Rs. 3141.51 OIL, Rs. 11457.54 NTPC,Rs.310.15 RCF,Rs.627.84 NALCO,Rs. 1514.50 SAIL | ||
2013-14 | 15819.46 | Rs.571.71 MMTC, Rs.259.56 HCL, Rs.101.08 NFL, Rs.30.17 ITDC, Rs.4.54 STC, Rs.358.21 NLC, Rs.2131.28 NHPC, Rs. 1637.32 PGCIL,Rs.497.32 EIL,Rs. 1886.78 BHEL, Rs. 5341.49 IOCL, Rs. 3000 CPSE-ETF | ||
2014-15 | 24328.93 | Rs.3.60 Employee OFS of NFL,Rs. 48.16 Employee OFS of NTPC,Rs.1719.54 SAIL, Rs.22557.63 COAL INDIA | ||
2015-16 | 1610.00 | Rs.1610.00 REC | ||
Total | 178729.42 |
* Out of Rs.5371.11, Rs. 4184 corer constitute receipts from cross purchase of shares of ONGC, GAIL and IOC.
** Out of Rs.1479.27, Rs.459.27 corer constitutes receipts from cross purchase of shares of ONGC, GAIL and IOC.
The government of India(GOI) and the economists those favored disinvestment and advocated on the behalf of disinvestment because they thought due to massive disinvestment that means privatization of public sector enterprises , the country will achieve high GDP growth, low income inequality, greater employment opportunity ,improvement of social development indicator(good latrine facility, huge internet users, life expectancy rate at birth, good sanitation condition, availability of LPG to every citizens, high educational enrollment, low degradation of environmental elements, teacher-student ratio, low poverty, availability of drinking water facility, high HDI,low HPI, low GINI coefficient etc) high export earning bill, low import bill payment, low government expenditure, high government revenue ,low fiscal deficit, low social discrimination and high economic development. Ultimately we can conclude that according to supporter economist and politician of disinvestment program. the country will achieve sustainable development. Now we should check whether this is true or not?
The disinvestment program were kept as totally stopped in the years 1993-94,2006-07,2008-09.The receipt of the government form massive disinvestment in the years were 2014-15,2013-14,2012-13,2011-12,2010-11,2009-10, and 2003-04 .Now in this paper we will check the economic change not only in the year of massive disinvestment but also in the year of zero disinvestment.
In 2012-13,2013-14,2014-15 the disinvestment receipt were 23956.81 corer ,15819.46 corer and 24328.93 corer ,but GDP growth in the year 2012-13 and 2013-14 were 4.47 and 4.74 respectively.On the contrary in 2006-07 and 2008-09 the disinvestment receipt was zero, but GDP growth in these year were 9.57 and 6.72 respectively.In the year 1993-94 total disinvestment receipt is zero , but GDP growth is 5.68. So we can not say that higher disinvestment ensure higher GDP growth in India.
THE DIAGRAMATIC REPRESENTATION OF DISINVESTMENT RECIEPT FROM 1991 TO 2016
Table-1

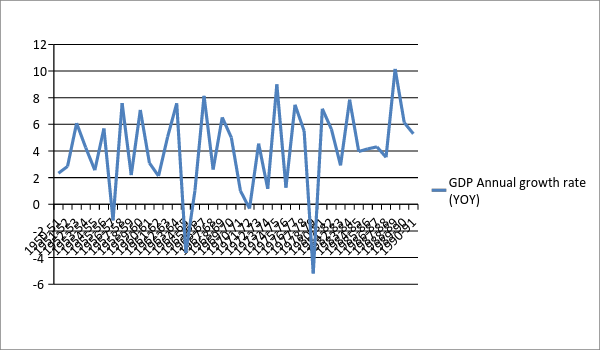
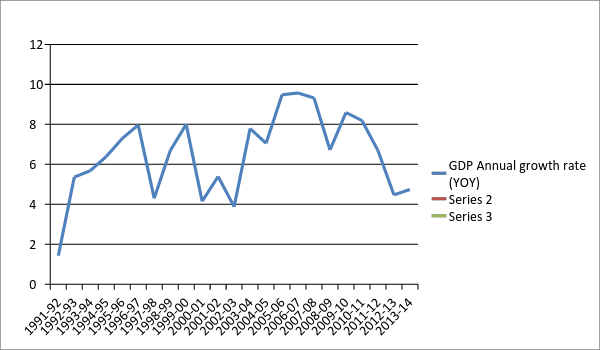
GDP Annual Growth Rate (YoY)
year | GDP Growth | year | GDP Growth | year | GDP Growth |
1951-52 | 2.33 | 1972-73 | -.32 | 1993-94 | 5.68 |
1952-53 | 2.84 | 1973-74 | 4.55 | 1994-95 | 6.39 |
1953-54 | 6.09 | 1974-75 | 1.16 | 1995-96 | 7.29 |
1954-55 | 4.25 | 1975-76 | 9.00 | 1996-97 | 7.79 |
1955-56 | 2.56 | 1976-77 | 1.25 | 1997-98 | 4.30 |
1956-57 | 5.69 | 1997-78 | 7047 | 1998-99 | 6.68 |
1957-58 | -1.21 | 1978-79 | 5.50 | 1999-00 | 8.00 |
1958-59 | 7.59 | 1979-80 | -5.20 | 2000-01 | 4.15 |
1959-60 | 2.19 | 1980-81 | 7.17 | 2001-02 | 5.39 |
1960-61 | 7.08 | 1981-82 | 5.63 | 2002-03 | 3.88 |
1961-62 | 3.10 | 1982-83 | 2.92 | 2003-04 | 7.97 |
1962-63 | 2.12 | 1983-84 | 7.85 | 2004-05 | 7.05 |
1963-64 | 5.06 | 1984-85 | 3.96 | 2005-06 | 9.48 |
1964-65 | 7.58 | 1985-86 | 4.16 | 2006-07 | 9.57 |
1965-66 | -3.65 | 1986-87 | 4.31 | 2007-08 | 9.32 |
1966-67 | 1.02 | 1987-88 | 3.53 | 2008-09 | 6.72 |
1967-68 | 8.14 | 1988-89 | 10.16 | 2009-10 | 8.59 |
1968-69 | 2.61 | 1989-90 | 6.13 | 2010-11 | 8.91 |
1969-70 | 6.52 | 1990-91 | 5.29 | 2011-12 | 6.69 |
1970-71 | 5.01 | 1991-92 | 1.43 | 2012-13 | 4.47 |
1971-72 | 1.01 | 1992-93 | 5.36 | 2013-14 | 4.74 |
GDP Annual Growth Rate (YoY
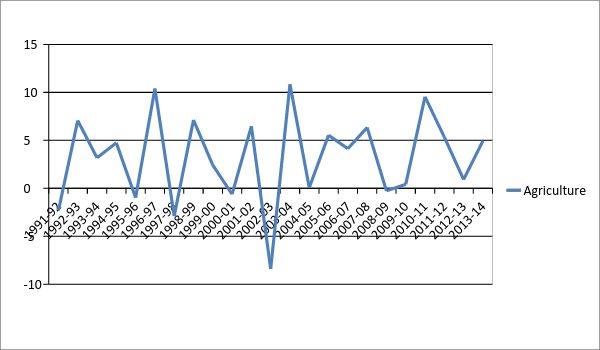
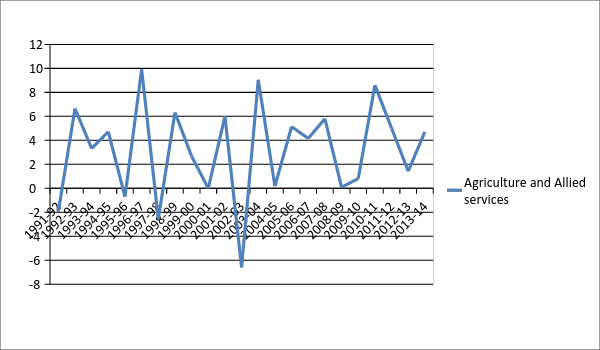
year | Agriculture and Allied services | Agriculture | Industry | Mining and Quarrying | Manufacturing | Service |
1991-92 | -1.95 | -2.31 | 0.34 | 3.36 | -2.40 | 4.69 |
1992-93 | 6.65 | 7.06 | 3.22 | 0.92 | 3.09 | 5.69 |
1993-94 | 3.32 | 3.18 | 5.50 | 1.39 | 8.59 | 7.38 |
1994-95 | 4.72 | 4.74 | 9.16 | 9.29 | 10.82 | 5.84 |
1995-96 | -0.70 | -0.98 | 11.29 | 5.87 | 15.46 | 10.11 |
1996-97 | 9.92 | 10.40 | 6.39 | 0.55 | 9.50 | 7.53 |
1997-98 | -2.55 | -2.90 | 4.01 | 9.81 | 0.05 | 8.93 |
1998-99 | 6.32 | 7.12 | 4.15 | 2.83 | 3.13 | 8.28 |
1999-00 | 2.67 | 2.41 | 5.96 | 4.19 | 5.39 | 12.05 |
2000-01 | -0.01 | -0.61 | 6.03 | 2.31 | 7.30 | 5.07 |
2001-02 | 6.01 | 6.46 | 2.61 | 1.86 | 2.27 | 6.61 |
2002-03 | -6.60 | -8.41 | 7.21 | 8.42 | 6.87 | 6.74 |
2003-04 | 9.05 | 10.84 | 7.32 | 2.70 | 6.34 | 7.89 |
2004-05 | 0.18 | 0.07 | 9.81 | 7.91 | 7.38 | 8.28 |
2005-06 | 5.14 | 5.53 | 9.72 | 1.31 | 10.10 | 10.91 |
2006-07 | 4.16 | 4.13 | 12.17 | 7.47 | 14.32 | 10.06 |
2007-08 | 5.80 | 6.34 | 9.67 | 3.69 | 10.28 | 10.27 |
2008-09 | .09 | -0.27 | 4.44 | 2.14 | 4.33 | 9.98 |
2009-10 | 0.81 | 0.41 | 9.16 | 5.89 | 11.30 | 10.50 |
2010-11 | 8.60 | 9.54 | 7.55 | 6.54 | 8.86 | 9.67 |
2011-12 | 5.02 | 5.34 | 7.81 | 0.10 | 7.41 | 6.57 |
2012-13 | 1.42 | 0.91 | 0.96 | -2.16 | 1.14 | 9.96 |
2013-14 | 4.71 | 4.93 | 0.35 | -1.38 | -0.71 | 7.00 |
It is found in this paper that in the year 2011-12,2012-13 a massive disinvestment program has taken specially in 2012-13 the disinvestment amount was Rs 23956.81 corer , but the agriculture and allied service growth rate was only 1.42% where as in the year 2006-07,1993-94 the disinvestment receipt was zero but the agriculture and allied service growth rate were 4.16% and 3.32% respectively. In the year 1996-97 the disinvestment receipt was Rs379.67 corer but the agriculture and allied sector growth rate was 9.92% where as in 2002-03 total disinvestment amount was 3347.98(Rs. Corer) where as the growth of agriculture and allied service sector is -6.60%. So we can conclude in this context that the disinvestment does not permit high growth in the agriculture and allied service sector.
In the same way we have found out from data table that in the year 2002-03 the agriculture sector growth rate was -8.41% and in 1996-97 it was 10.40% where as in the years of zero disinvestment the growth rate of agriculture sector were 4.13% and 3.18 % respectively.
The diagrammatic and table representation of Industrial sector represents a very interesting result that is in the zero disinvestment years we got 5.5%(1993-94),12.17%(2006-07) and 4.44%(2008-09) respectively.The massive disinvestment years represents a lower growth rate of industry are 0.96%(2012-13) and 0.35%(2013-14) .In the year 1995-96 the industrial growth rate was 11.29 but disinvestment amount was just Rs 168.48 corer.The correlation between disinvestment and industrial growth is totally paradoxical .
In the Manufacturing sector the zero disinvestment years illustrate 8.59%(1993-94),14.32%(2006-07),and 4.3%(2008-09) growth rate respectively. Where as the massive disinvestment year 2012-13 and 2013-14 illustrate very low growth rate 1.14% and.71% respectively.
In the service sector ,the zero disinvestment years represents 14.32%,4.33% and 7.38% respectively where as high disinvestment years represents 9.96%(2012-13) and 7% (2013-14) growth rate in service sector.

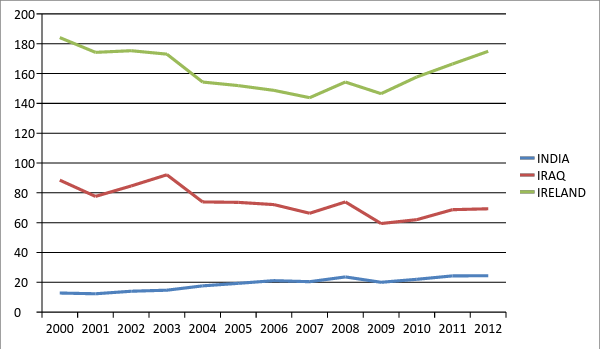
EXPORT GOODS AND SERVICES % GDP
YEAR | INDIA | IRAQ | IRELAND |
2000 | 12.8 | 75.7 | 95.6 |
2001 | 12.3 | 65.3 | 96.6 |
2002 | 14 | 70.6 | 90.7 |
2003 | 14.7 | 77.4 | 80.9 |
2004 | 17.6 | 56.3 | 80.4 |
2005 | 19.3 | 54.3 | 78.3 |
2006 | 21.1 | 51 | 76.6 |
2007 | 20.4 | 45.9 | 77.5 |
2008 | 23.6 | 80.3 | 80.4 |
2009 | 20 | 59.4 | 87.1 |
2010 | 22 | 40 | 95.7 |
2011 | 24 | 44.4 | 97.7 |
2012 | 24.4 | 44.9 | 105.6 |
Indian export is not gradually increased with the rapid change of privatization of the government sector.The increment of Indian export was very slowly with respect to Iraq and Ireland.
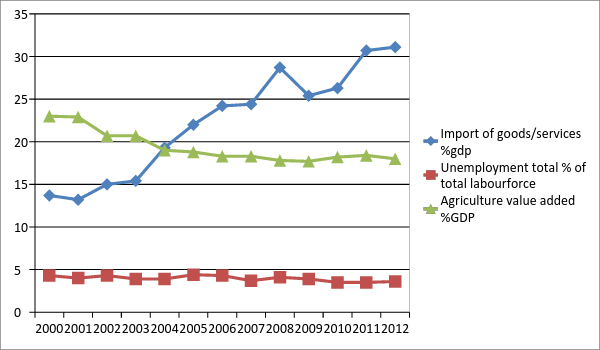
Indian Economy*
YEAR | Import of goods/services % GDP | Unemployment total(%of total labour force) | Agriculture value added (%of Gdp) |
2000 | 13.7 | 4.3 | 23.0 |
2001 | 13.2 | 4 | 22.9 |
2002 | 15 | 4.3 | 20.7 |
2003 | 15.4 | 3.9 | 20.7 |
2004 | 19.3 | 3.9 | 19 |
2005 | 22 | 4.4 | 18.8 |
2006 | 24.2 | 4.3 | 18.3 |
2007 | 24.4 | 3.7 | 18.3 |
2008 | 28.7 | 4.1 | 17.8 |
2009 | 25.4 | 3.9 | 17.7 |
2010 | 26.3 | 3.5 | 18.2 |
2011 | 30.7 | 3.5 | 18.4 |
- | - | - | - |
2012 | 31.1 | 3.6 | 18 |
We thought that the massive disinvestment program will stimulate India's inward oriented production so that India will meet low level import bill.But we got adverse result that means from above table representation it is clear the import bill continuously rises from 2000 to 2012 rapidly.so the massive disinvestment totally faiure to decrease the huge amount import bill.
The unemployment rate was more-or-less constant.The agricultural contribution to GDP continuously decreased over time.
YEAR | Inflation CPI(annual%ofGDP) | Inflation GDP deflator (annual%) | % Internet users |
2000 | 4 | 3.6 | 0.5 |
2001 | 3.7 | 3.2 | 0.7 |
2002 | 4.4 | 3.7 | 1.5 |
2003 | 3.8 | 3.9 | 1.7 |
2004 | 3.8 | 5.7 | 2.0 |
2005 | 4.2 | 4.2 | 2.4 |
2006 | 6.1 | 6.4 | 2.8 |
2007 | 6.4 | 5.8 | 4 |
2008 | 8.4 | 8.7 | 4.4 |
2009 | 10.9 | 6.1 | 5.1 |
2010 | 12 | 9 | 7.5 |
2011 | 8.9 | 6.4 | 10.1 |
2012 | 9.3 | 7.6 | 12.6 |
In the above table and below diagrammatic representation illustrate inflation rate continuously rises over time .The
Massive implementation of disinvestment program does not ensure lower inflation .The internet users in India is so far away from developed nations .The LPG system is partially success to modernize the Indian society.

year | CO2emissions metric tons(per capita) | Life expectancy at birth |
2000 | 1.1 | 62.2 |
2001 | 1.1 | 62.6 |
2002 | 1.1 | 67.9 |
2003 | 1.2 | 63.3 |
2004 | 1.2 | 63.7 |
2005 | 1.3 | 64.1 |
2006 | 1.3 | 64.5 |
2007 | 1.4 | 64.8 |
2008 | 1.5 | 65.1 |
2009 | 1.7 | 65.4 |
2010 | 1.7 | 65.7 |
2011 | 66.0 | |
2012 | 66.2 |
It is concerning matter to our future generation that if CO2 emission increases over time then various environmental problem will emerge and as result our future generation will face very pathetic environmental degradation such as tsunami, high temperature and so on. On the other hand , the life expectancy rate at birth of Indian remained more-or-less constant over time and this is due to insufficient health expenditure in Indian budget.

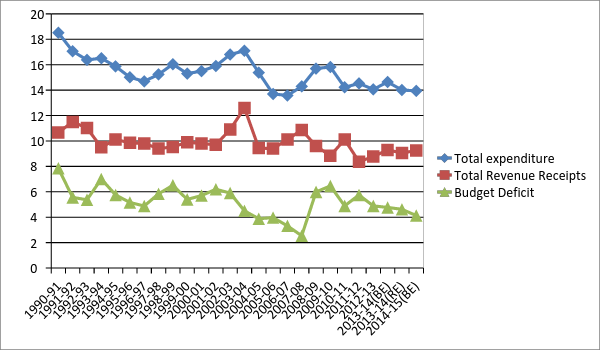
The government of India strongly has opinioned on the behalf low level fiscal deficit due to massive disinvestment program. But in the below table and diagrammatic representation shows that in the zero disinvestment year 2006-07 , India has found lower level fiscal deficit that is 3.32% of total GDP. So we can not say that higher level disinvestment means lower level fiscal deficit.
Central Government: Revenue, Expenditure and Fiscal Deficit (% of GDP at current market prices)
Year | Total Revenue Receipts | Total Expenditure | Fiscal Deficit |
1990-91 | 10.67 | 18.52 | 7.85 |
1991-92 | 11.50 | 17.06 | 5.56 |
1992-93 | 11.02 | 16.38 | 5.37 |
1993-94 | 9.50 | 16.51 | 7.01 |
1994-95 | 10.12 | 15.87 | 5.75 |
1995-96 | 9.85 | 15.01 | 5.16 |
1996-97 | 9.81 | 14.69 | 4.88 |
1997-98 | 9.40 | 15.24 | 5.84 |
1998-99 | 9.53 | 16.04 | 6.51 |
1999-00 | 9.90 | 15.30 | 5.40 |
2000-01 | 9.80 | 15.50 | 5.70 |
2001-02 | 9.70 | 15.90 | 6.20 |
2002-03 | 10.9 | 16.80 | 5.90 |
2003-04 | 12.60 | 17.10 | 4.50 |
2004-05 | 9.44 | 15.37 | 3.88 |
2005-06 | 9.40 | 13.70 | 3.97 |
2006-07 | 10.11 | 13.58 | 3.32 |
2007-08 | 10.87 | 14.29 | 2.54 |
2008-09 | 9.60 | 15.70 | 5.99 |
2009-10 | 8.84 | 15.82 | 6.46 |
2010-11 | 10.11 | 14.22 | 4.89 |
2011-12 | 8.37 | 14.53 | 5.75 |
2012-13 | 8.77 | 14.06 | 4.89 |
2013-14(BE) | 9.29 | 14.64 | 4.77 |
2013-14(RE) | 9.06 | 14.01 | 4.62 |
2014-15(BE) | 9.24 | 13.94 | 4.13 |
Source : Budget documents. The 2013-14 figures are RE and the 2014-15 figures are BE; BE - Budget Estimates
Note : The ratios to GDP at current market prices are basd on the CSO's National Accounts 2004-05 Series.(DATA book for ps;4th August 2014).
Now we should give our kind attention on the socio economic development of India so that we can understand the consequences of the impact of disinvestment on social development indicator.
Household Having Assets
Total No of Households (excluding institutional households)
246692667
Radio, Transistor Television Computer/Laptop
19.9 % 47.2% Total-9.5% (with Internet-
3.1%; Without Internet-6.4%)
Telephone/mobile phone- 63.2% Bicycle Car/Jeep/Van
Landline only-4.0% 44.8% 4.7%
Mobile only-53.2%
Both-6.0%
Scooter, Motor cycle, moped none of the specified of
21.0% the assets possessed by
The household -17.8%
Distribution of household by Type of Fuel Used for Cooking
Total No of Households (excluding institutional households)
246692667
Firewood Crop Residue Cow dung cake
49.0% 8.9% 8.0%
Coal, Lignite, Charcoal Kerosene LPG
1.5% 2.9% 28.6%
Electricity Biogas Any other No cooking
0.1% 0.4 % 0.5% 0.3%
Banking Services and Ownerships Status
Household availing banking services-58.7%
Owned households-86.6%
Rented households-11.1%
Other households-2.4%
Distribution of Households by Source of Lighting
Electricity kerosene solar energy Other oil
67.3 % 31.4% 0.4 % 0.2%
Any Other No Lighting
0.2% 0.5%
Distribution of Households by Number of dwelling Rooms
No exclusive room-3.9% ; One Room- 37.1% ;Two Room-31.7%
Three Room-14.5%; Four Rooms-7.5%;Five Rooms-2.6%; Six Rooms and above-2.8%
Household size
1memeber-3.7%; 2 member-9.7% ; 3 member-13.7% ; 4members-22.7%; 5member -18.8%; 6-8 member- 24.9%; 9+ member-6.6.
Latrine Facility Available Within Premises
I) Flush /Poor flush latrine connected to
Premises Piped Sewer system Septic Tank Other System
46.9% 12.0% 22.2% 2.3%
II)Pit Latrine
With slab/Ventilated improved Pit Without slab/open pit
7.6% 1.8%
III) Other Latrine
Night soil disposed into open drain -0.5%
Night soil removed by human-0.3%; Night soil serviced by animal .02%
Distribution of household by Availability of drinking Water Facility
I)Tap Water: Total 43.5%
From treated source :32.0%
From untreated source:11.6%
II) Well: Total -11.00%
Covered well Uncovered well Hand pump Tub well Spring
1.6% 9.4% 33.5% 8.5%
River/cannel tank/Pond/Lake Any other Source
0.6% 0.8% 1.5%
III) Availability of Drinking water source
Within the premises-46.6%
Near the Premises-35.8% and Away -17.6%.
Distribution of Household by Predominate Material of Wall
Grass, Thatch, Bamboo etc-9.0%; Plastic, Polythene-0.3%
Mud, Unburnt brick-23.7% ;Wood-0.7%
Stone: Total-14.1%
Not packed with morter-3.4%;Packed with morter-10.8%
G.I, Metal,Asbestors Sheets-0.6% ;Burnt brick-47.5%
Concrete -3.5% ;Any other Material-0.6%
Distribution of Households by Predominant Material of Roof
Grass, Thatch, Bamboo, wood, Mud etc: 15.1%
Plastic/Polythene-0.6%; Brick-6.65%; Concrete-29.1%;Stone/slate- 8.6%; G.I ,Metal Asbestos ,Sheets-15.9%.
TILES :TOTAL-23.8%
Hand made tiles-14.5%; Machine made tiles-9.3%
Any other material-0.4%.
HDI Trends In India :1980-2011
1980 1990 1995 2000 2005 2010 2011 RANK-2011 0.344 0.410 0.461 0.504 0.535 0.542 0.547 134
The Effect of Disinvestment on Formal Employment
*After privatization of Airport Centaur within a day all 677 employees who were working with hotel Airport centaur lost their jobs and one living in Pathetic condition. No one heard then, they are dying every day………………………………..
*After privatization of hotel Juhu centaur ,510 employees lost their jobs .
*After privatization profit making company VSNL ,2200 employees out of 3000 lost their jobs.
*By passing the parliament ,the GOI sold profit making company surplus of Rs.6550 corer BALCO to Vedanta group for only Rs.551 Corer. Majority employees lost their jobs.
*If ONGC is privatized totally by central government ,then 34000 thousand formal employee have lost their jobs.
*The Indian Railway is called as blood circulation system in India.
1652000 Employees in1991 and 1511000 employees in 31st March ,2002 and today figure come down to 1361519.
Trade unions consider privatization will promote employers' interests. The trade unions claim that private sector cannot guarantee that itwill be always productive and contribute positively to the economy of the country.
The BMS precisely listed the implications of privatization such as
(a) Increase in evasion of labour laws.
(b) No respect for trade union rights.
(c) Employment would shrink drastically
(d) Private sector would not enter into long term projects hence the absence of long term employment.
(e) Working conditions would be poor and exploitative.
(f) Work load of works would increase.
(g) Safety, health, training of employees and pollution control mechanisms would remain neglected dimensions.
However there is not enough evidence to suggest that privatization would destroy jobs. In India, experts have suggested that there might be reduction in employment in the short run but in the long run they have assured that more employment opportunities would be generated. Reducing employment to a small extent for the viability of a unit is better than closing down the unit after a little while. The experiments of privatization in Mexico show that through privatization did cause some decline in employment in the short run, employment levels rose very quickly in most companies.
After the globalization of Indian economy there has been reduction in employment generation in organized sector. Only in private sector the rates of employment generation has been increased, but the sector has only 31% volume of employment in the total employment in organized sector. So the major part of employment (69%) related in public sector and the employment generation in this sector have been very low16. Another feature of globalization is that it wll reduce domestic production because, now have no compulsion to produce the things of our uses, we can get these without producing by importing which is comparatively cheaper than to produce domestic things and due to globalization we are becoming more consumers than producers, therefore small productive activities create small employment opportunities. Therefore the impact of globalization on employment generation in Indian organized sector particularly on public sector effected negatively with regard to employment generation in India.
Effects on poverty and unemployment
Poverty and unemployment go hand in hand because poverty is associated with unemployment. With implementation of economic reforms serious consequences would arise. Therefore serious efforts need to be made to promote job oriented plans. Serious adverse repercussions will be faced by labour unless social security measures like unemployment, insurance based on tripartite contributions are also introduced.
The above development in relation to economic reforms leads to increase in poverty, unemployment and flexible employment particularly during the short term workforce, reduction drives in both public and private sectors, which results in reduction in the size of labour force in the already thin organized sector where about 26 million or less than 9% of the total work force in the country. In the former East Germany on the eve of unification and the transition that followed, one out of every three jobs was reportedly lost. In some of the major industries which got restructured or privatized in the U.K during Margaret Thatcher's period jobs were lost, such industries included coal and steel, among others, when Japanese National Railways was privatized, nearly 3 lakh workers were declared surplus.
A Bombay based trade union research group estimated an average decline in full-time, permanent employment in 34 firms in Bombay at about 20.5% between 1980 and 1990.
Another study (Sarat 1992) of six industries – Tea (West Bengal) Textiles (West Bengal) Power (Andhra Pradesh) Ports (All ports) Engineering (West Bengal and Andhra Pradesh) and Chemicals and Pharmaceuticals (Maharashtra) pointed to a decline in full time employment and unionization rates during the 1980s. The study also pointed to a rise in the incidence of casual and contract Employment.
Trade unions are very much effected not only by rise in unemployment but also with current restructuring process. Labour displacement due to structural adjustment programme will result in a shift in employment and most of the workers working in formal sector were displaced into informal sector where there is little protection and labour laws cannot be implemented properly against those working in informal sector besides there will be no union activities to fight for wages and working conditions.
Economic reorganization or structural adjustment programme resulted in enhancement of poverty, unemployment and flexible employment in which regular employment or permanent employment would be deteriorated year by year. The percentage of regular employment will be reduced and flexible employment such as outsourcing contractual workers, part time workers, casual worker and home workers would be increased. Figure-1 summarizes the new employment relations not only in developed countries but also in developing countries. Therefore we may conclude that flexible employment relations are the order of the day which has a greater impact on the strength of the trade unions.
New Employment Relations in the developed and developing countries
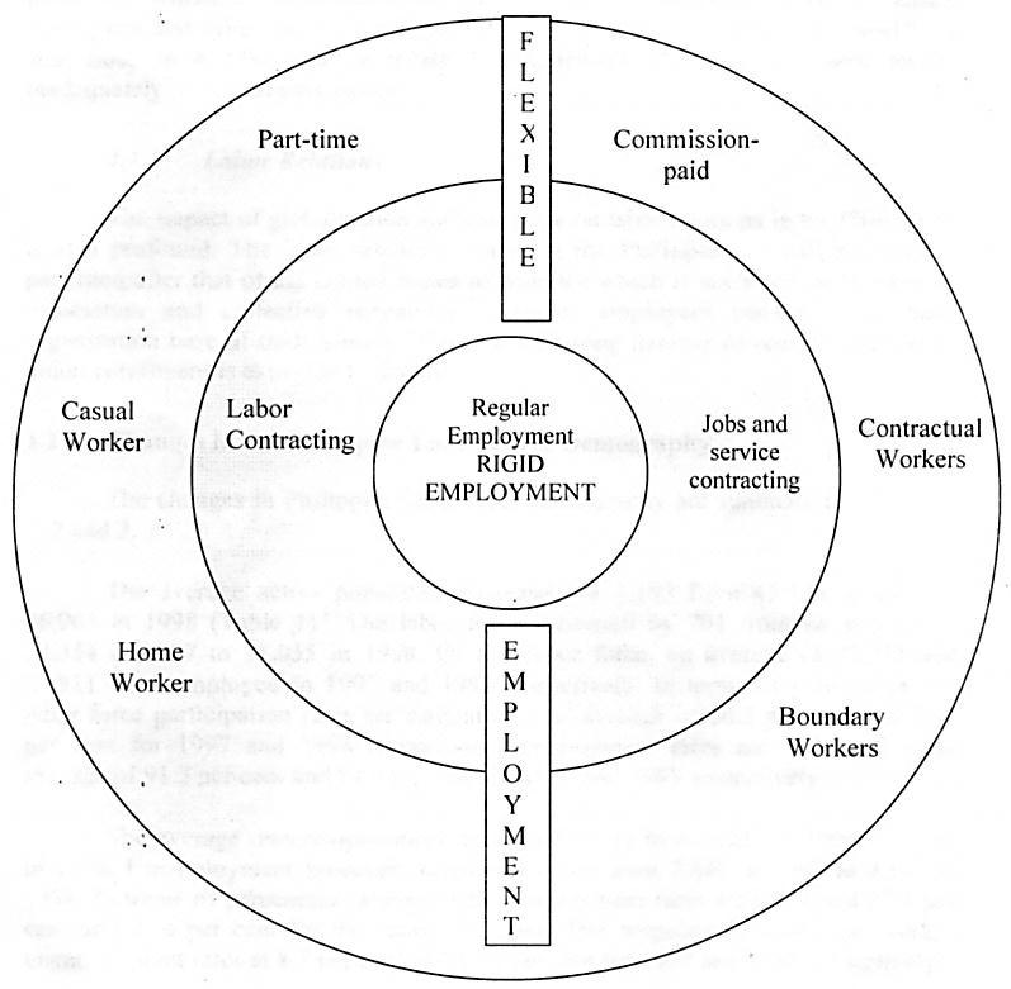
At the center are the regular employees whose number is dwinding as a consequence of adjustment measures. These are the legally adequately protected employees. The second level consist of employees covered by triangular or trilateral arrangements. Compared to the regular employees, these types of workers generally do not enjoy security of tenure. And at the third or outer most levels are the other types of bilateral employment relations. These consists of home workers, workers in a boundary system, part-time workers, commission-paid workers, contractual workers, casual employees and other similar employee groups. Compared to the regular work force and those in a triangular or trilateral arrangement, they are the most legally inadequately protected employees.
A study of labour markets and structural adjustment in 12 developing countries (Horton et.al., 1951) drew there major conclusions.
(a) Firstly real wages are more flexible than is generally supposed, which suggests that labour markets are not a source of rigidity impending adjustment.
(b) Secondly, in response to structural adjustment, labour has moved in the direction opposite to that usually associated with economic development, it has shifted back into agriculture, out of manufacturing and out of public sector.
(c) Thirdly, recession plus adjustment have also resulted in an increase in informalisation, greater use of casual labour, decreased worker benefits, and decline in wages differentials for skill and possibility for education32.
If we examine above conclusions labour in some countries welcomed structural adjustment programme and become part and parcel of economic reforms.
Employment implications
The outcome of reforms and industrial restructuring is retrenchment or loss of employment "An estimated 4.17 lakh workers are employed in 58 chronically sick units in the central public sector which were initially identified for closure".
The effects of economic reforms on labour
1. In coming years, as the labour market gets flooded with 10 million more unemployed, the trade unions would find it difficult to mitigate the adverse consequences of the structural changes.
2. Workers on a large scale will be retrenched and no trade union action will enable them to find new jobs. The unions would lose their credibility to some extent.
3. Trade unions would hardly able to pinpoint the spare resources for job creation as they would go into profit making production.
4. Unions would continuously fail in preventing the control of industries by a handful of industrial groups.
5. Trade unions would be forced to cooperate with the managements to tide over various crisis.
6. While some big trade unions would fight with their backs to the wall, the smaller unions would fadeout in the long run.
7. The employment perspective will be for the trade unions, the foremost point in their actions.
8. Trade unions find it most difficult to organize unions in nearly established industries, their hands been full with problems.
9. Private industries with imported would prefer to have company unions passing a challenge to the trade union movement.
10. More unions will be freed from political dominance.
11. The big trade unions in their efforts to survive will seek more efficient interdependent system of functioning.
12. Keeping in view the emphasis on work culture, the trade unions will be modifying their internal working order more and more services of the outsiders will be incorporated in their day to day functioning.
13. Trade unions will be seeking protection more through contractual obligations than from industrial disputes act.
14. The grand idea of participation in management will die its natural death. The managements of new modern industries would keep the workers organizations at an arms length.
15. The workers in general would turn a deaf ear to the voice of the trade unions.
16. Trade unions will have no alternative but to have one center of labour, thus ending, all the multiplicity of unions.
FINDINGS
Ŷ(GDP) = 14.19 + 0.09X : R2= 0.09, P value= 7.78E – 20
Ŷ(DISINVESMENT EFFECT ON AGGRICULTURE AND ALLIED SERVICE)= 1.6 + 6.40X, R2=0.12, P value= 0.201883
Ŷ(DISINVESTMENT EFFECT ON AGGRICULTURE)= 3.45 – 1.6X, R2= 0.0058,P – 0.03401
Ŷ(EXPORT)= 17.20+7.03X, R2=0.165, P-4.21E – 07
Ŷ(IMPORT)= 19.92 + 9.64X, R2= 0.139, P-5.89E – 06
Ŷ(FISCAL DIFICIT)= 11.277 + 0.09X, R2= 0.096, P- 5.62E -18
Ŷ(INDUSTRY)= 6.68 – 1.55X, R2= 0.010, P- 3.59E – 06
Ŷ(INFLATION)= 5.99 + 2.58X, R2= 0.046,P- 0.000417
Ŷ(MANUFACTUREING)= 7.30 – 3.10X, R2= 0.023, P- 6.16E – 05
Ŷ(UNEMPLOYMENT)= 4.027 – 0.30X, R2= 0.054, P- 3.789 - 12
CONCLUSION
Disinvestment plays a very important role in Indian political economy. By simple regression analysis, considering disinvestment as independent variable and gdp growth, agriculture and allied services, agriculture growth,export,import,fiscal deficit,inflation,manufacturing,unemployment ,as dependent variable, we got adverse result in every case. So politician and economists should give kind attention on disinvestment program whether it is positively or negatively affected on Indian economy.
REFERENCE
Department of Disinvestment –Ministry of Finance (Government of India)
Prime Minister's Council on Trade and Industry (GOI)
Disinvestment commission of GOI
E-Book on Major Activities and Achievements (Ministry of Finance Department of Disinvestment New Delhi)
Employment and unemployment situations in cities and towns in India(NSSO 68th Round) july2011-june2012
Ministry of statistics and program implementation GOI
NSSO report no.(68/10/5)
SUMMARY OUTPUT | |||||||||||||||||
Regression Statistics | |||||||||||||||||
Multiple R | 0.290747 | ||||||||||||||||
R Square | 0.084534 | ||||||||||||||||
Adjusted R Square | 0.044731 | ||||||||||||||||
Standard Error | 0.902082 | ||||||||||||||||
Observations | 25 | ||||||||||||||||
ANOVA | |||||||||||||||||
| df | SS | MS | F | Significance F | ||||||||||||
Regression | 1 | 1.728253 | 1.728253 | 2.123806 | 0.158545 | ||||||||||||
Residual | 23 | 18.71631 | 0.813753 | ||||||||||||||
Total | 24 | 20.44456 |
|
|
| ||||||||||||
| Coefficients | Standard Error | t Stat | P-value | Lower 95% | Upper 95% | Lower 95.0% | Upper 95.0% | |||||||||
Intercept | 14.18364 | 0.478141 | 29.66411 | 7.78E-20 | 13.19453 | 15.17275 | 13.19453 | 15.17275 | |||||||||
X Variable 1 | 0.088412 | 0.060667 | 1.457328 | 0.158545 | -0.03709 | 0.213912 | -0.03709 | 0.213912 | |||||||||
SUMMARY OUTPUT | |||||||||||||||||
Regression Statistics | |||||||||||||||||
Multiple R | 0.352389 | ||||||||||||||||
R Square | 0.124178 | ||||||||||||||||
Adjusted R Square | 0.082472 | ||||||||||||||||
Standard Error | 3.909627 | ||||||||||||||||
Observations | 23 | ||||||||||||||||
ANOVA | |||||||||||||||||
| df | SS | MS | F | Significance F | ||||||||||||
Regression | 1 | 45.51128 | 45.51128 | 2.977477 | 0.099118 | ||||||||||||
Residual | 21 | 320.9889 | 15.28518 | ||||||||||||||
Total | 22 | 366.5002 |
|
|
| ||||||||||||
| Coefficients | Standard Error | t Stat | P-value | Lower 95% | Upper 95% | Lower 95.0% | Upper 95.0% | |||||||||
Intercept | 1.603984 | 1.217494 | 1.317447 | 0.201883 | -0.92793 | 4.135901 | -0.92793 | 4.135901 | |||||||||
X Variable 1 | 6.408639 | 3.713998 | 1.725537 | 0.099118 | -1.31504 | 14.13232 | -1.31504 | 14.13232 | |||||||||
SUMMARY OUTPUT | |||||||||||||||||
Regression Statistics | |||||||||||||||||
Multiple R | 0.075875 | ||||||||||||||||
R Square | 0.005757 | ||||||||||||||||
Adjusted R Square | -0.04396 | ||||||||||||||||
Standard Error | 4.865584 | ||||||||||||||||
Observations | 22 | ||||||||||||||||
ANOVA | |||||||||||||||||
| df | SS | MS | F | Significance F | ||||||||||||
Regression | 1 | 2.741587 | 2.741587 | 0.115806 | 0.737177 | ||||||||||||
Residual | 20 | 473.4781 | 23.6739 | ||||||||||||||
Total | 21 | 476.2197 |
|
|
| ||||||||||||
| Coefficients | Standard Error | t Stat | P-value | Lower 95% | Upper 95% | Lower 95.0% | Upper 95.0% | |||||||||
Intercept | 3.44121 | 1.512106 | 2.275773 | 0.03401 | 0.287012 | 6.595409 | 0.287012 | 6.595409 | |||||||||
X Variable 1 | -1.59316 | 4.681585 | -0.3403 | 0.737177 | -11.3588 | 8.172457 | -11.3588 | 8.172457 | |||||||||
SUMMARY OUTPUT | |||||||||||||||||
Regression Statistics | |||||||||||||||||
Multiple R | 0.405003 | ||||||||||||||||
R Square | 0.164027 | ||||||||||||||||
Adjusted R Square | 0.08803 | ||||||||||||||||
Standard Error | 4.093687 | ||||||||||||||||
Observations | 13 | ||||||||||||||||
ANOVA | |||||||||||||||||
| df | SS | MS | F | Significance F | ||||||||||||
Regression | 1 | 36.16978 | 36.16978 | 2.158324 | 0.169809 | ||||||||||||
Residual | 11 | 184.341 | 16.75827 | ||||||||||||||
Total | 12 | 220.5108 |
|
|
| ||||||||||||
| Coefficients | Standard Error | t Stat | P-value | Lower 95% | Upper 95% | Lower 95.0% | Upper 95.0% | |||||||||
Intercept | 17.22356 | 1.628396 | 10.57701 | 4.21E-07 | 13.63949 | 20.80764 | 13.63949 | 20.80764 | |||||||||
X Variable 1 | 7.032713 | 4.787012 | 1.469124 | 0.169809 | -3.50343 | 17.56886 | -3.50343 | 17.56886 | |||||||||
SUMMARY OUTPUT | ||||||||
Regression Statistics | ||||||||
Multiple R | 0.37236 | |||||||
R Square | 0.138652 | |||||||
Adjusted R Square | 0.060348 | |||||||
Standard Error | 6.190051 | |||||||
Observations | 13 | |||||||
ANOVA | ||||||||
| df | SS | MS | F | Significance F | |||
Regression | 1 | 67.84675 | 67.84675 | 1.770682 | 0.210223 | |||
Residual | 11 | 421.484 | 38.31673 | |||||
Total | 12 | 489.3308 |
|
|
| |||
| Coefficients | Standard Error | t Stat | P-value | Lower 95% | Upper 95% | Lower 95.0% | Upper 95.0% |
Intercept | 19.91282 | 2.462293 | 8.087106 | 5.89E-06 | 14.49335 | 25.33229 | 14.49335 | 25.33229 |
X Variable 1 | 9.631955 | 7.238426 | 1.33067 | 0.210223 | -6.29971 | 25.56362 | -6.29971 | 25.56362 |
SUMMARY OUTPUT | ||||||||
Regression Statistics | ||||||||
Multiple R | 0.309102297 | |||||||
R Square | 0.09554423 | |||||||
Adjusted R Square | 0.054432604 | |||||||
Standard Error | 0.819099415 | |||||||
Observations | 24 | |||||||
ANOVA | ||||||||
| df | SS | MS | F | Significance F | |||
Regression | 1 | 1.55924 | 1.55924 | 2.32402 | 0.141638 | |||
Residual | 22 | 14.76032 | 0.670924 | |||||
Total | 23 | 16.31957 |
|
|
| |||
| Coefficients | Standard Error | t Stat | P-value | Lower 95% | Upper 95% | Lower 95.0% | Upper 95.0% |
Intercept | 11.27604913 | 0.435269 | 25.90596 | 5.62E-18 | 10.37336 | 12.17874 | 10.37336 | 12.17874 |
X Variable 1 | 0.083979121 | 0.055087 | 1.524474 | 0.141638 | -0.03026 | 0.198223 | -0.03026 | 0.198223 |
SUMMARY OUTPUT | ||||||||
Regression Statistics | ||||||||
Multiple R | 0.103886 | |||||||
R Square | 0.010792 | |||||||
Adjusted R Square | -0.03631 | |||||||
Standard Error | 3.455634 | |||||||
Observations | 23 | |||||||
ANOVA | ||||||||
| df | SS | MS | F | Significance F | |||
Regression | 1 | 2.735925 | 2.735925 | 0.229112 | 0.637129 | |||
Residual | 21 | 250.7696 | 11.94141 | |||||
Total | 22 | 253.5055 |
|
|
| |||
| Coefficients | Standard Error | t Stat | P-value | Lower 95% | Upper 95% | Lower 95.0% | Upper 95.0% |
Intercept | 6.677796 | 1.073423 | 6.221031 | 3.59E-06 | 4.445491 | 8.9101 | 4.445491 | 8.9101 |
X Variable 1 | -1.54758 | 3.23317 | -0.47866 | 0.637129 | -8.27133 | 5.176166 | -8.27133 | 5.176166 |
SUMMARY OUTPUT | ||||||||
Regression Statistics | ||||||||
Multiple R | 0.214285112 | |||||||
R Square | 0.045918109 | |||||||
Adjusted R Square | -0.040816608 | |||||||
Standard Error | 3.020809973 | |||||||
Observations | 13 | |||||||
ANOVA | ||||||||
| df | SS | MS | F | Significance F | |||
Regression | 1 | 4.831009 | 4.831009 | 0.529409 | 0.482056 | |||
Residual | 11 | 100.3782 | 9.125293 | |||||
Total | 12 | 105.2092 |
|
|
| |||
| Coefficients | Standard Error | t Stat | P-value | Lower 95% | Upper 95% | Lower 95.0% | Upper 95.0% |
Intercept | 5.980956138 | 1.201625 | 4.977391 | 0.000417 | 3.336198 | 8.625715 | 3.336198 | 8.625715 |
X Variable 1 | 2.570211423 | 3.532428 | 0.727605 | 0.482056 | -5.20461 | 10.34503 | -5.20461 | 10.34503 |
SUMMARY OUTPUT | ||||||||
Regression Statistics | ||||||||
Multiple R | 0.151644 | |||||||
R Square | 0.022996 | |||||||
Adjusted R Square | -0.02353 | |||||||
Standard Error | 4.725609 | |||||||
Observations | 23 | |||||||
ANOVA | ||||||||
| df | SS | MS | F | Significance F | |||
Regression | 1 | 11.03791 | 11.03791 | 0.494278 | 0.489747 | |||
Residual | 21 | 468.9589 | 22.33138 | |||||
Total | 22 | 479.9968 |
|
|
| |||
| Coefficients | Standard Error | t Stat | P-value | Lower 95% | Upper 95% | Lower 95.0% | Upper 95.0% |
Intercept | 7.322341 | 1.467915 | 4.988261 | 6.16E-05 | 4.269646 | 10.37504 | 4.269646 | 10.37504 |
X Variable 1 | -3.10845 | 4.421387 | -0.70305 | 0.489747 | -12.3032 | 6.086325 | -12.3032 | 6.086325 |
SUMMARY OUTPUT | ||||||||
Regression Statistics | ||||||||
Multiple R | 0.232059 | |||||||
R Square | 0.053852 | |||||||
Adjusted R Square | -0.03216 | |||||||
Standard Error | 0.320241 | |||||||
Observations | 13 | |||||||
ANOVA | ||||||||
| df | SS | MS | F | Significance F | |||
Regression | 1 | 0.064208 | 0.064208 | 0.626083 | 0.445522 | |||
Residual | 11 | 1.1281 | 0.102555 | |||||
Total | 12 | 1.192308 |
|
|
| |||
| Coefficients | Standard Error | t Stat | P-value | Lower 95% | Upper 95% | Lower 95.0% | Upper 95.0% |
Intercept | 4.0261 | 0.127386 | 31.60542 | 3.78E-12 | 3.745724 | 4.306475 | 3.745724 | 4.306475 |
X Variable 1 | -0.29631 | 0.374479 | -0.79125 | 0.445522 | -1.12053 | 0.527915 | -1.12053 | 0.527915 |
| ||||||
No comments:
Post a Comment